States With the Least Carbon-Intensive Economies
World leaders convened in Glasgow this November for the 2021 United Nations Climate Change Conference. Facing the intensification of global climate change, the negotiators reached an agreement that explicitly commits to reducing the use of coal, limiting other greenhouse gas emissions, and providing support to developing countries most impacted by climate change.
The Glasgow conference reflected heightened urgency around climate change as the effects of carbon emissions have accelerated and become more severe in recent years. A 2021 report from the Intergovernmental Panel on Climate Change found that without rapid reductions in greenhouse gas emissions, warming above 1.5°C is almost inevitable. This level of warming would have disastrous effects in the form of sea level rise, more severe weather events, and harm to agricultural systems and human health.
While there is still much work to do, the good news for the U.S. is that many states and the country as a whole have begun to reverse the growth in carbon emissions. Government policy to limit emissions and advancements in lower-emission technologies across the economy have helped turn the trends in the right direction.

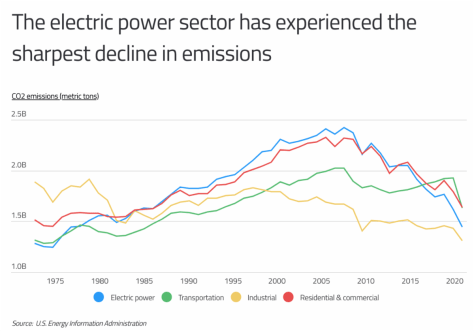
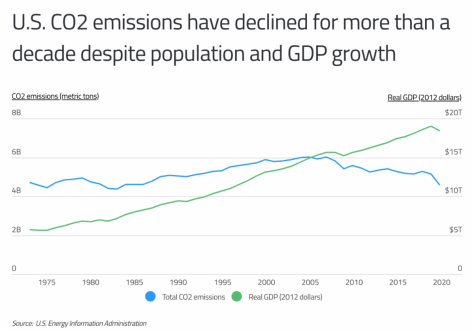
Much of this progress has taken place over the last fifteen years. Total CO2 emissions peaked in 2007 at over 6 billion metric tons, but that figure fell to around 4.6 billion metric tons in 2020. One of the big contributors has been decarbonization in electric power generation due to the decline of heavy-emitting coal and the rise of clean energy sources like wind and solar. Over the last decade, these factors have reduced CO2 emissions associated with electric power generation by around 36%. And this trend also contributes to emissions reductions in the main “end-use” sectors—transportation, industrial, residential, and commercial—that consume electricity. Residential and commercial have seen the sharpest declines, with emissions dropping by more than a quarter since 2010 across both sectors combined.

Encouragingly, these declines have taken place even while the U.S. population and economy have continued to grow. From 1970 to the mid-2000s, carbon emissions and GDP grew together, with the pace of GDP growth exceeding that of carbon emissions. More recently, the steady upward trajectory of GDP has continued while carbon emissions have ticked downward. Since 2007, total energy-related CO2 emissions are down by 23.9% while real GDP has increased by 17.7% in the same span. These trends help alleviate concerns that reducing carbon emissions necessarily means limiting economic productivity, and many U.S. states are proving that economic growth in a less carbon-intensive economy is possible.
The data used in this analysis is from the U.S. Energy Information Administration and the U.S. Census Bureau. To determine the states with the least carbon-intensive economies, researchers at Commodity.com calculated total CO2 emissions per GDP. States with a lower value were ranked higher. In the event of a tie, the state with lower per capita CO2 emissions was ranked higher.
Here are the states with the least carbon-intensive economies.
| State | Rank | CO2 emissions per GDP (tons per $ million) | CO2 emissions per capita | Total CO2 emissions (tons) | Largest source of CO2 emissions |
|---|---|---|---|---|---|
| New York | 1 | 123.6 | 9.0 | 175,900,000 | Petroleum |
| Washington | 2 | 135.9 | 10.2 | 77,000,000 | Petroleum |
| Connecticut | 3 | 136.8 | 10.5 | 37,600,000 | Petroleum |
| California | 4 | 148.0 | 9.0 | 356,600,000 | Petroleum |
| Massachusetts | 5 | 158.1 | 9.4 | 64,600,000 | Petroleum |
| New Hampshire | 6 | 158.9 | 10.5 | 14,300,000 | Petroleum |
| Vermont | 7 | 163.9 | 9.4 | 5,900,000 | Petroleum |
| Oregon | 8 | 164.5 | 9.5 | 39,900,000 | Petroleum |
| New Jersey | 9 | 198.0 | 11.9 | 105,400,000 | Petroleum |
| Maryland | 10 | 200.3 | 10.2 | 61,700,000 | Petroleum |
| Rhode Island | 11 | 206.5 | 10.5 | 11,100,000 | Petroleum, Natural Gas |
| Hawaii | 12 | 249.7 | 14.4 | 20,500,000 | Petroleum |
| Arizona | 13 | 252.1 | 13.1 | 93,900,000 | Petroleum |
| Illinois | 14 | 253.0 | 16.7 | 212,200,000 | Petroleum |
| Maine | 15 | 254.9 | 11.0 | 14,800,000 | Petroleum |
| United States | – | 287.2 | 16.2 | 5,297,400,000 | Petroleum |
For more information, a detailed methodology, and complete results, you can find the original report on Commodity.com’s website: https://commodity.com/blog/


Leave a Reply