U.S. States Most Dependent on Fossil Fuels
With the effects of global climate change becoming increasingly apparent, policymakers across the U.S. are moving to reduce the nation’s reliance on carbon-based fossil fuels.
At the beginning of his term, President Joe Biden rejoined the Paris Climate Accord, and in April, the Biden Administration announced aggressive new greenhouse gas reduction goals, including an overall aim to reduce U.S. greenhouse gas pollution to half of 2005 levels by 2030. Meanwhile, nearly 40 states have adopted renewable portfolio standards to facilitate a transition away from fossil fuels for energy production to renewables.
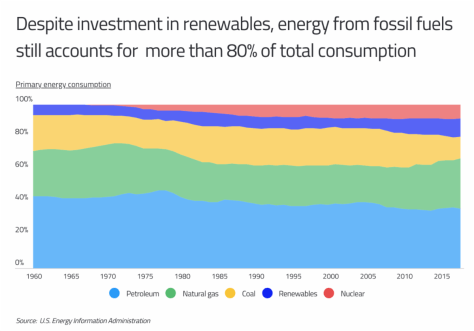
Despite these efforts, however, fossil fuel consumption remains deeply entrenched in the U.S. economy, and it could take years to transition away from fossil fuels as the country’s primary energy source.

Petroleum remains the leading source of energy in the U.S., accounting for approximately one-third of energy consumed. Energy consumption from natural gas expanded over the last decade as the rise of hydraulic fracturing made it less costly to extract. Most of that growth has come at the expense of coal, which represented 22.7% of the energy consumed in 2008 but just 13.1% a decade later. And while nuclear has held steady and renewables have continued to grow with improved technology and greater scale, fossil fuels still represent more than 80% of total energy consumption in the U.S. each year.

One example of the difficulties of shifting away from fossil fuels is consumers’ relationship to gasoline and car travel. Recently, gasoline prices have been on the rise again: prices dropped sharply in 2020, as many travelers and commuters stayed off the roads during the COVID-19 pandemic. Now, with many public health restrictions being relaxed as cases decline and more people get vaccinated, prices have topped $3 per gallon nationally for the first time since 2014. But despite what the laws of supply and demand might suggest, rising prices do not strongly affect driver behavior: research shows they tend to purchase the same amount of gasoline regardless of how much it costs. Instead, breaking drivers’ reliance on fossil fuels will depend on auto manufacturers providing more hybrid and electric options, whether by choice or by policy, like California’s zero-emission vehicle regulations.
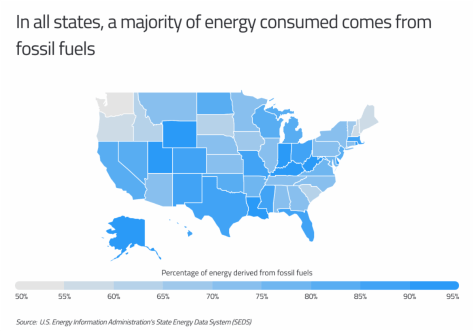
State-level data reinforces that there is a long way to go before the transition away from fossil fuels is complete. Every single U.S. state derives at least 50% of its energy from fossil fuels, and a total of nine states derive more than 90% of their energy from fossil fuels. Among the most dependent are small states like Delaware and Rhode Island, which import most of their energy from elsewhere, and states with rich stores of fossil fuels, like Alaska, West Virginia, and Kentucky. At the other end of the spectrum are states like Washington, Oregon, and New Hampshire, which rely more on nuclear and renewables like hydroelectric power and derive less than 60% of their energy from fossil fuels.

To find the states most dependent on fossil fuels, researchers at Commodity.com used data from the U.S. Energy Information Administration to calculate the percentage of total primary energy consumption from coal, natural gas, and petroleum in 2018 (the most recent available data). Researchers also calculated the percentage of total primary energy consumption derived from renewable sources, as well as the largest fossil fuel source.
Here are the states most dependent on fossil fuels.
| State | Rank | Percentage of energy derived from fossil fuels | Percentage of energy derived from renewables | Total energy consumed from fossil fuels (trillion BTU) | Total energy consumed from renewables (trillion BTU) | Largest fossil fuel source
|
|---|---|---|---|---|---|---|
| Delaware | 1 | 96.4% | 3.6% | 213.1 | 8.0 | Petroleum |
| Alaska | 2 | 95.9% | 4.1% | 584.8 | 25.0 | Natural Gas |
| West Virginia | 3 | 95.4% | 4.6% | 1,103.3 | 53.7 | Coal |
| Rhode Island | 4 | 95.0% | 5.0% | 189.1 | 10.0 | Natural Gas |
| Kentucky | 5 | 94.1% | 5.9% | 1,616.5 | 102.1 | Coal |
| Wyoming | 6 | 93.5% | 6.5% | 793.2 | 54.9 | Coal |
| Indiana | 7 | 93.4% | 6.6% | 2,617.2 | 185.9 | Coal |
| Utah | 8 | 93.1% | 6.9% | 830.0 | 61.3 | Petroleum |
| Louisiana | 9 | 92.1% | 3.7% | 3,895.5 | 155.0 | Petroleum |
| Texas | 10 | 89.9% | 7.1% | 12,752.3 | 1,009.0 | Petroleum |
| Ohio | 11 | 89.7% | 4.7% | 3,040.2 | 158.6 | Natural Gas |
| Hawaii | 12 | 89.4% | 10.6% | 261.8 | 31.1 | Petroleum |
| Colorado | 13 | 88.8% | 11.2% | 1,305.1 | 164.6 | Natural Gas |
| Mississippi | 14 | 88.2% | 6.1% | 1,116.6 | 76.8 | Natural Gas |
| Missouri | 15 | 88.0% | 5.9% | 1,608.7 | 108.5 | Coal |
| United States | – | 80.5% | 11.2% | 81,238.0 | 11,281.6 | Petroleum |
For more information, a detailed methodology, and complete results, you can find the original report on Commodity.com’s website: https://commodity.com/blog/


Leave a Reply