States That Consume the Most Natural Gas
As the world navigates the effects of climate change, policymakers are looking for strategies and investments to reduce carbon emissions and slow global warming. Global leaders met in Glasgow earlier this year to negotiate new targets for greenhouse gas reduction and climate change mitigation. In the U.S., investments in clean energy and the electric grid were a major component of the $1.2 trillion infrastructure package that Congress passed and President Joe Biden recently signed into law.
As policymakers work to reduce emissions, natural gas occupies a unique position in the U.S. energy mix. In recent years, widespread adoption of extraction techniques like hydraulic fracturing have made natural gas cheaper to produce. This has made natural gas an economically viable, cleaner-burning alternative to other heavy-emitting fossil fuels like coal. But natural gas does still produce carbon emissions, and as clean energy sources like wind and solar themselves become less expensive, the future of natural gas is uncertain.
Progressive governments with a focus on reducing carbon emissions, like California at the state level and Seattle at the local level, have enacted new building codes to discourage or restrict the use of natural gas in new construction. Simultaneously, states that have benefited from the natural gas boom, like Texas, Oklahoma, and Louisiana, have banned municipalities in their states from enacting similar policies.
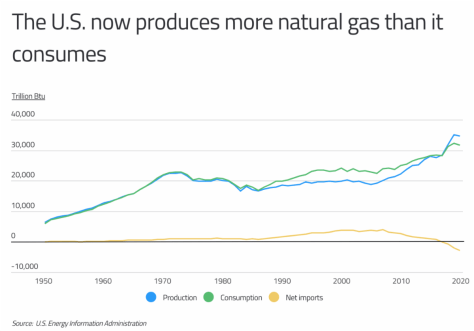
For now, the boom in production means that the U.S. is currently a net exporter of natural gas, producing more natural gas than it consumes. Production and consumption closely tracked together up until the mid-1980s, at which point consumption rose above production levels and natural gas imports increased. With the rise of fracking in the early 2000s, this trend began to reverse, and by 2017, natural gas production overtook consumption in the U.S., and the country became a net exporter.

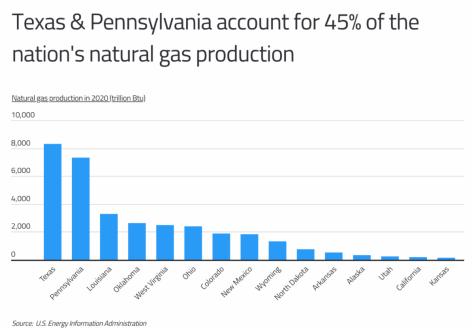
But the greatest production increases have been limited to a handful of states. Texas has been a longtime leader in U.S. energy production due to its plentiful oil and natural gas reserves, and the state currently produces 8,288 trillion BTUs each year. Pennsylvania is a more recent beneficiary of the natural gas boom. Natural gas was difficult to extract in the state until horizontal drilling became common around 2008, but Pennsylvania quickly grew to become the second most productive state for natural gas. Texas, Pennsylvania, and other states that have reaped the economic benefits of expanded natural gas production may be most resistant to any transition away from natural gas as an energy source.

Beyond the interests of states that produce a high volume of natural gas, transitioning away from natural gas will also be difficult for states where natural gas is one of the primary sources of energy for consumers. Some states derive more than half of the energy they consume from natural gas, led by Alaska at 57.6%. These states will require affordable alternative energy sources at a wide scale before a transition will be possible.
The data used in this analysis is from the U.S. Energy Information Administration and the U.S. Census Bureau. To determine the states consuming the most natural gas, researchers at Commodity.com calculated total natural gas consumption per person. Researchers also included statistics on total natural gas consumption, the percentage of total state energy consumption derived from natural gas, and the percentage of total U.S. natural gas consumption accounted for by each state.
Here are the states consuming the most natural gas.
| State | Rank | Natural gas consumption (million Btu per person) | Total natural gas consumption (trillion Btu) | Percentage of total state energy consumption | Percentage of all U.S. natural gas consumption |
|---|---|---|---|---|---|
| Alaska | 1 | 484.3 | 354.3 | 57.6% | 1.1% |
| Louisiana | 2 | 425.9 | 1,979.8 | 46.1% | 6.2% |
| Wyoming | 3 | 287.5 | 166.4 | 30.8% | 0.5% |
| Oklahoma | 4 | 217.8 | 861.8 | 51.4% | 2.7% |
| Mississippi | 5 | 195.0 | 580.2 | 53.4% | 1.8% |
| North Dakota | 6 | 189.5 | 144.4 | 21.6% | 0.4% |
| Texas | 7 | 164.8 | 4,779.5 | 33.6% | 14.9% |
| Alabama | 8 | 152.6 | 748.1 | 38.9% | 2.3% |
| New Mexico | 9 | 145.5 | 305.1 | 41.5% | 0.9% |
| Indiana | 10 | 138.7 | 933.9 | 33.6% | 2.9% |
| Iowa | 11 | 137.0 | 432.1 | 26.4% | 1.3% |
| West Virginia | 12 | 132.8 | 238.0 | 28.8% | 0.7% |
| Pennsylvania | 13 | 130.6 | 1,671.3 | 43.8% | 5.2% |
| Arkansas | 14 | 123.0 | 371.1 | 33.9% | 1.2% |
| South Dakota | 15 | 110.1 | 97.4 | 24.2% | 0.3% |
| United States | – | 98.0 | 32,169.8 | 32.1% | N/A |
For more information, a detailed methodology, and complete results, you can find the original report on Commodity.com’s website: https://commodity.com/blog/


Leave a Reply